|
Downloads
Wiki
Build CodeLite
Devs
|
Main /
UsingBreakpointsUsing BreakpointsDuring a debugging session, CodeLite can set breakpoints, temporary breakpoints and watchpoints. These can be conditional, ignored or disabled, and can be associated with command-lists. Breakpoints can be set by file/line-number, function or memory address. Setting BreakpointsSetting Breakpoints by line-numberThis is the commonest type of breakpoint, and there are three ways to set one. The easiest is to click on the left margin of that line, just to the right of the line-number. This creates a new breakpoint on that line. Clicking on a line which already has a breakpoint deletes the breakpoint. Exactly the same could be done by using the Debug > Toggle Breakpoint menuitem, or the associated shortcut, F9 by default.
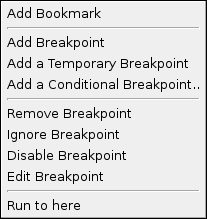 Breakpoint-icon context menu
The third way to add a line-number breakpoint is from the Breakpoints tab of the Debugger pane, as described below.
 A standard breakpoint A standard breakpoint
 A standard breakpoint, disabled A standard breakpoint, disabled
 A conditional breakpoint. It will be grey if disabled. A conditional breakpoint. It will be grey if disabled.
 A breakpoint with commands. It will be grey if disabled. A breakpoint with commands. It will be grey if disabled.
 An ignored breakpoint An ignored breakpoint
A breakpoint icon's tooltip displays information about the breakpoint e.g. its condition or commands.
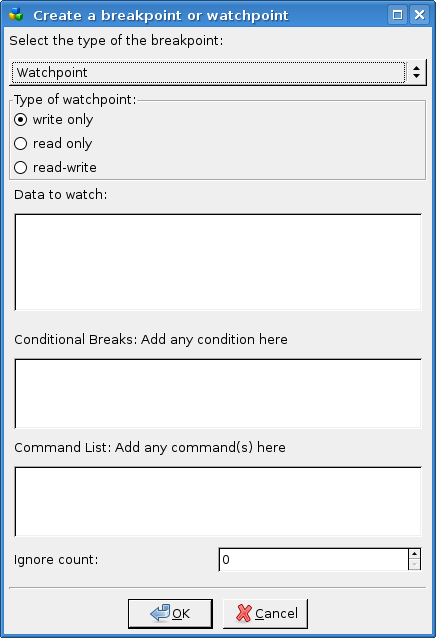
Setting other types of BreakpointSetting a breakpoint on a function or at a memory address can only be done from the 'Create a breakpoint...' dialog. To run this dialog, click the 'Add' button in the Breakpoints tab of the Debugger Pane.
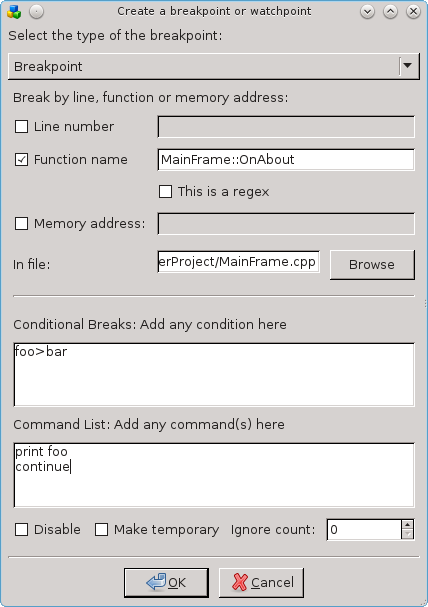
This dialog has informative tooltips, to help you set more complex breakpoints correctly.
Editing Breakpoints
You can also edit a breakpoint using a version of the 'Create a breakpoint...' dialog. To obtain this, choose 'Edit' from the breakpoint's context menu, or right-click the breakpoint's entry in the Breakpoints tab of the Debugger Pane, or select it in that tab and click 'Edit'. The dialog is identical to the 'Create' one, except that there's an extra option of disabling/enabling the breakpoint. Miscellaneous
If you have a breakpoint, and you need it on a different line, you can move it there by drag-and-drop, using Shift+Left-button. That's not particularly exciting if it's just a standard breakpoint (it would have been at least as easy to delete it and create a new one); but if the breakpoint has complicated commands or conditions, it saves you having to enter these again. You may wish to set breakpoints inside a shared library that will be loaded by your program. In theory, you can warn gdb that you're doing this by checking the Enable pending breakpoints box in the Debugger Settings dialog; in practice this doesn't always work. So CodeLite stores any breakpoints that gdb can't apply; when this happens, an extra button appears in the Breakpoints tab of the Debugger Pane, Set Pending. Clicking this tells gdb to try again; if it succeeds, the button will disappear again and the breakpoint entries and markers will become visible. Watchpoints
You can only set a watchpoint from the 'Create a breakpoint...' dialog as described above. Use the wxChoice at the top of the dialog to create a watchpoint instead. Again the tooltips should be helpful. Note that the most common situation for wanting to use a watchpoint is to watch for alterations to a variable. However, as soon as that variable loses scope, gdb deletes the watchpoint. This makes it difficult to watch a local variable. |