|
Downloads
Wiki
Build CodeLite
Devs
|
Main /
DebuggerPaneThe Debugger Pane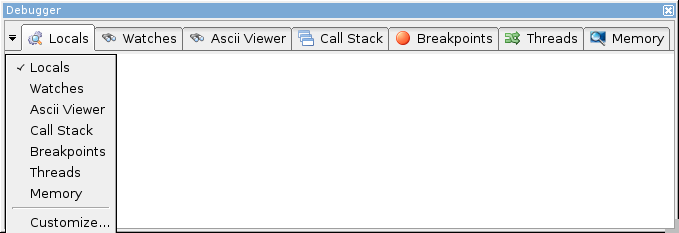 The Debugger Pane, showing its menu (click the marker in the top-left corner)
The Locals Tab
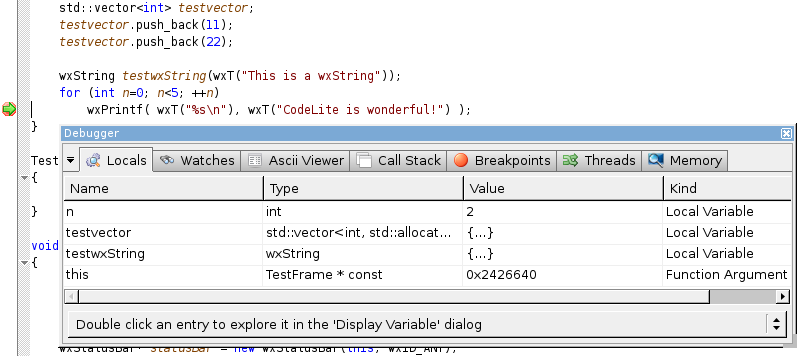 The Locals tab, also showing the code being debugged
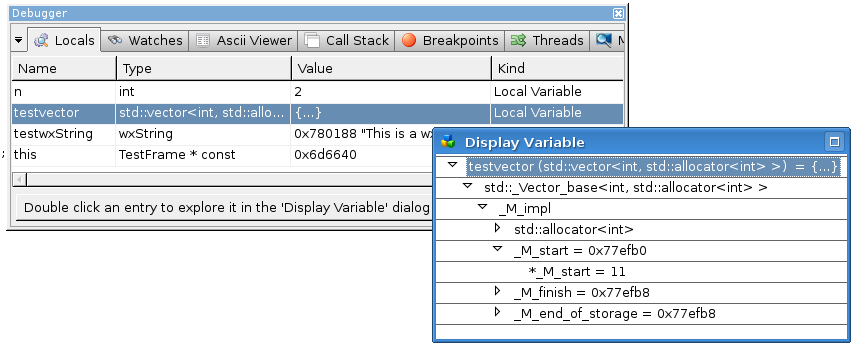 Activating an item lets you expand it If you need to investigate an item further, you can do this by double-clicking (or optionally single-clicking: see the wxChoice...) on the item. This will open in a 'Display Variable' dialog, where it can be expanded as required.
The Watches Tab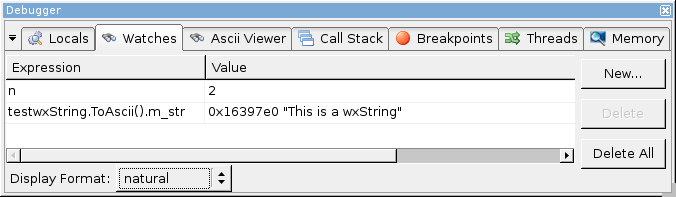 A Watch is a continuous view of a variable or expression: every time the debugger pauses, CodeLite queries it, so that each expression is updated. You can add new watches by clicking "New" on this tab's toolbar; or, more easily, by right clicking on an expression and selecting e.g. 'Add Watch', or 'Watch foo as wxString'. The Watches tab will then show the contents of wxString foo correctly, even in a unicode build. 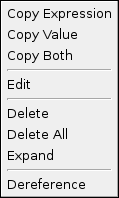 A Watch's Context Menu
You can also double-click it, when it will be opened in a 'Display Variable' dialog.
The Ascii Viewer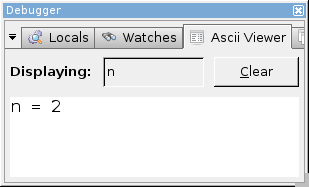
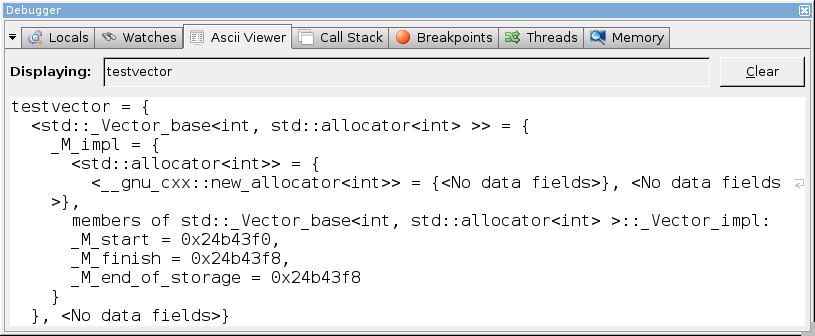
Some people will find the tooltip a bit intrusive. An alternative is the Ascii Viewer, which displays similar information, less transiently. Large amounts of data can easily be viewed, using the scrollbars. And you can even copy the data to the clipboard. One disadvantage is that, while it's part of the Debugger pane, you can't see the data when you're looking at one of the other tabs. The solution is to detach it (right-click over its tab and choose 'Detach'). You can then dock the detached 'tab' elsewhere, or let it float.
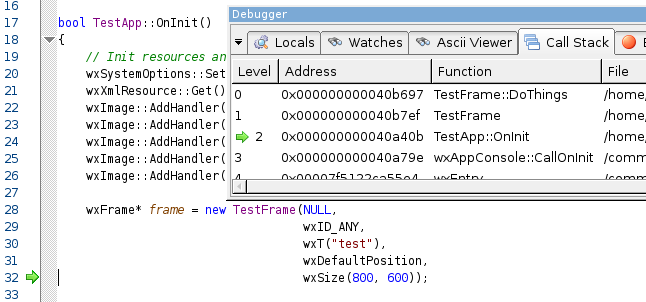
The Callstack Tab
Whenever the debugger is paused, the Call Stack tab shows the call stack, with the current frame indicated. Double-clicking on a line will change the stack to that frame, and also open the source-code at that line. This image shows level 2 and the corresponding code.
The Breakpoints Tab
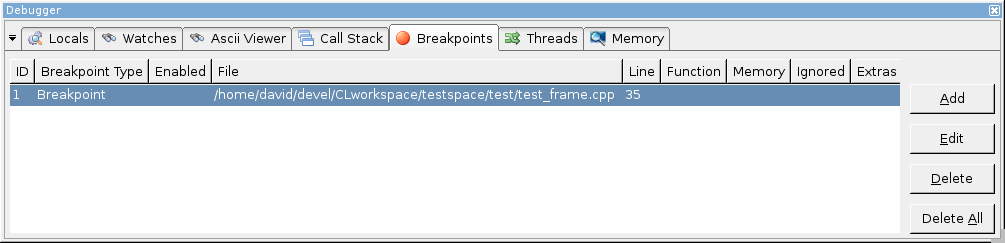
The Breakpoints tab is discussed further on the Breakpoints page.
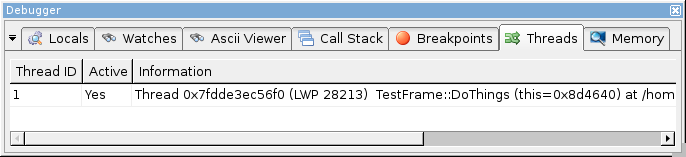
The Threads Tab
The Memory Tab
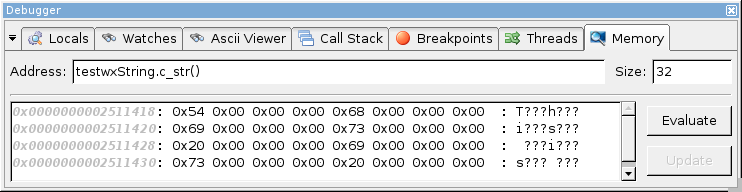 The Memory tab showing the raw contents of a unicode-build wxString
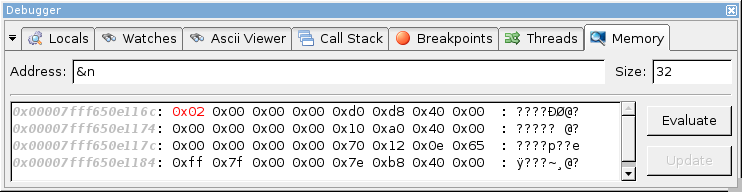 The Memory tab showing the contents of an int (n was 2)
|