Debugging With CodeLite
CodeLite can act as the front-end of a debugger, which currently is almost always gdb.
If you wish to debug a 'root' process with codelite without running codelite as root, simply run this command on your gdb (do it on your own risk):
sudo chmod ug+s /usr/bin/gdb
Starting the debugger
There are three sorts of debug session:
- Debugging the active project
- Attaching to an existing process
- Quick-debug
Debugging the active project
This is the normal sort of debugging. First, if your workspace contains more than one project, ensure that the active one is the desired project, with the project name shown in bold. If not, this can be changed by right clicking on the project and selecting 'Set as active', or by using the Workspace View toolbar.
Then start the debugger by:
- Pressing F5
- Clicking the appropriate tool in the Debug section of the main toolbar
- Debug menu > Start/Continue Debugger
CodeLite will start the debugger, automatically providing it with the following parameters:
- The executable to debug, taken from 'Project Settings -> Command'. See ProjectSettings
- Once the debugger is successfully started, it will pass the program arguments, taken from 'Project Settings -> Command Arguments'
Attach to a process
To select a process to debug, go to 'Debug -> Attach to process'; this will open a dialog with all current processes listed. Select the one to be debugged. Debugging then continues as above.
Quick Debug
This is described in detail in Debugging With Quick Debug.
The Debug Tab
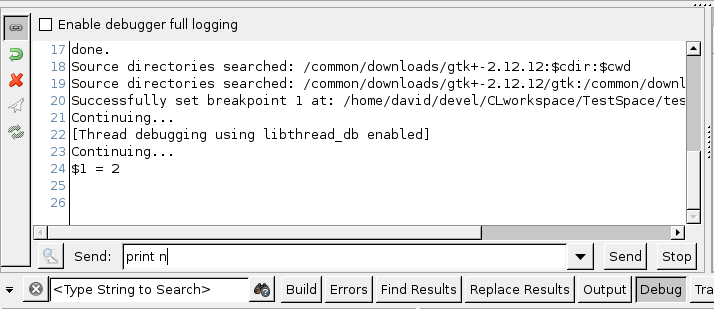
When the debugger starts, the Debug tab appears (at the bottom of CodeLite by default), and debugger output can be seen in it. You can ignore this most of the time: it's things like start-up messages from gdb, and confirmatory messages from CodeLite e.g. "Successfully set breakpoint 1 at...". However it can be used to interact with the debugger, as described below.
Occasionally you might want an even more detailed description of what is happening. If so, set "Enable full debugger logging" on either in the Debugger Settings dialog, or by checking the box on the top of the Debug tab.
Interacting with the debugger
Much of your interaction with the debugger will be via Breakpoints and the Debugger Pane, which are described fully elsewhere.

The Debug toolbar
Once the debugger is running, you can Pause, Continue and Stop it from the Debug menu and from the toolbar.
When a breakpoint has been hit, you will often want to step through the next lines of code. The commands Next, Step In and Step Out (Finish) are available as keyboard shortcuts and from the Debug menu; there are also Next and Step In tools in the Debug section of the toolbar. The green "You are Here" arrow in the editor margin indicates which line is the current one. If you have been inspecting other parts of the source code, clicking the Show Current Line tool takes you back to that arrow.
The following keyboard accelerators are available; the values shown are the defaults:
| Modifier | Key | GDB's command | Description |
| - | F5 | run/cont | Start the debugger, or Continue debugging after an Interrupt |
| - | F10 | next | Step over |
| - | F11 | step | Step into function |
| Shift | F11 | finish | Finish the execution of the current function (Step out) |
| - | F9 | b <line> | Insert or remove a breakpoint at the current line |
There are two other ways of interacting to mention:
- When the debugger starts up, a terminal window appears. This is normally just a nuisance, but it is where you'll find the output from wxLogDebug(), wxPrintf() etc. You can also use it to supply input, for those rare situations where it's needed.
- At the bottom of the Debug tab is a field labelled 'Send'. Commands typed here are sent straight to the debugger e.g. type 'info break' and all breakpoints will be listed in the debug tab. This is useful for inputting commands that CodeLite doesn't provide.
Context Menus
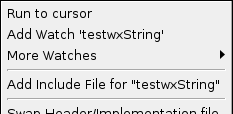 Part of the contextmenu; 'testwxString' was selected
Once the debug-session starts, the editor context menu (right-click menu), offers extra options:
- Run to cursor - instructs the debugger to resume debugging, then break at the line containing the cursor.
- Add Watch - adds the currently selected item (or if there's no selection, it uses the word under the cursor) to the Watches tab.
- There is also a submenu holding various "Watch as foo" entries; one for each item in the 'Pre-defined Types' section of the Debugger Settings dialog.
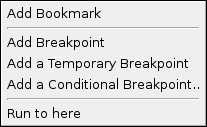
The margin context menu
Even when the debugger isn't running, right-clicking on a margin gives the opportunity to enter a breakpoint. This is discussed fully in Using Breakpoints.
Once it is running, Run to here is available too.